A word on visuals: Using text in slides part II
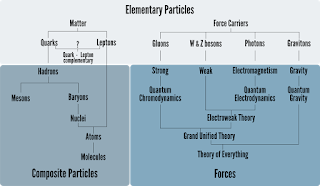
In part I I talked about the shape of the text in slides. In part II I want to address the content. There are two basic questions. One is, when is the use of words better than the use of pictures? And the other, how to effectively use words in pictures? Let me kick off with the diagram below that I found in Wikipedia and remixed. On question that putting the information shown here into a written form would take more time to process. This is the point that the director of the Data Visualization at the University of New Hampshire, Colin Ware, makes. According to Mr. Ware, hierarchical relationships are most effective presented in a structured diagram (Graphics 1, Text 0). Now take a look at the diagram below. It is called a flowchart, and it is used to graphical display an algorithm. In this case computing the factorial of n, n!. In case you wonder n! = 1 x 2 x ... x n. The pseudocode of this flowchart would be something like this: read n f = 1, m = 1 mark: f = f*m if(...
