Posts

Showing posts from 2012

Visual Examples: Combining Clip art with pictures

It is been a while since I have posted new visual examples. I'm thrilled about this one: not all pieces of clip art are created equal. The guys at Yiibu have done a great job combining clip art and pictures in a very interesting presentation. Enjoy!

Minitutorial: Creating a title slide from a portrait image

Image
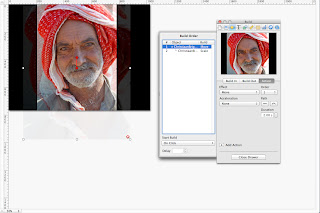
Back in January I promised I would do a tutorial on how to turn a portrait image into a full side slide. Well I can't start a series on tables without first doing that tutorial. Let's get started. The "problem" is simple, you have an image with the right height of a slide, the the width is not enough. In the case of a 1024 × 768 slide, some images come in the 512 × 768 size, so what to do with the other half? Case in point, Figure 1: Original portrait image. I would like to use this image taken from Wikimedia commons, but what to do with the other half? The result that I what to go is this Figure 2: turning Figure 1 into a full side slide With would give me white space and a sense of continuity that I really like. SO that's what we are going to do,  makeover Figure 1 into Figure 2.  The trick is simple, (1) we crop some pixels from Figure's 1 right border,  (2) stretch it to cover the rest of slide, and (3) blur it.  There is pre-processing and s

"What are the important numbers here?" — How to improve tables. Part 1

Image
The presentation of data in tables is a usual practice in scientific talks. Sadly, most tables are ineffective. In this first installment, I give a n example of before and after table design.  Writing about tables is something I wanted to do for long time, after all quantitative data is at the heart of science and its communication. Tables are ubiquitous, and if you are like me, you learned how to design them by imitation. The problem is, most tables suck, as illustrated in this quote Getting information from a table is like extracting sunlight from a cucumber. — Farquhar & Farquhar, 1891 By the way, I got this quote from Wainer, H. (1992). Understanding graphs and tables. Educational Researche r, 21, 14-23, as well as the images below. Tables should communicate, but instead they are used as a dump of tabular data, which the audience is supposed to  navigate through, understand and make sense of. Oh yeah, all of that in a couple of minutes. Let's dive in. Before

Every presentation ever!

Image
I watched this video some months ago on Duarte's blog, and finished the book last weekend. I recommend the book,  it has some fresh views of presentation. Specially relevant is the analogy of how presentations resemble  bottled water. Water (the message) is timeless, precious, and always important. The bottle (the package) has adapted through time and socienties to deliver the message. Enjoy it!

Mini Tutorial: The Ken Burns effect in slideware

Image
First  things first, what is the Ken Burns effect? Take a look at this "video" That simultaneous zooming and moving of the image (call panning) is called the Ken Burns effect. Using this effect you can literally move from the "big picture" to the details within seconds without losing your audience. And it is easy to do. Now, if (like me) are a documentary fan, you might have seen this effect before The tutorial I got the idea of this tutorial from Jakob Jochmann's Cutting Edge Keynote. This last video is made of two slides, the  first one has a size of 1538 × 2048 but has been reduced to 576 × 768 to fit in the canvas that is 1024 × 768. The next step is add the zoom (scale) and move action. Image of man from Wikimedia Commons by Christaan Briggs under CC-by-SA license. The order of the action doesn't matter for their are set to be simultaneous.  After adding the move, add the zoom(scale). In this case I zoomed 135% so that man's chin in

Improve your slides using icons

Image
Last week I briefly mentioned the Icon Representation Principle. Let's dig in a bit further. According to Lidwell, Holden and Butler (LHB) the use of pictorial images makes easier to learn and remember concepts .  They list  4 classes of iconic representation: Similar icons . Images that are visually analogous to an action, object or concept. They are most efficient to represent a simple concept.  Example icons . Images that exemplify or are commonly associated with a concept. They are useful to represent complex concepts.  Symbolic icons . Images that represent a concept at a high level of abstraction. Mostly efficient when involved concept involves well-established and easily recognizable objects.   Arbitrary Icons  So much for the theory, let's go to the example. If you are interested in more check out their book Universal Principle of Design . The prime idea of the slide is to show the  4 dimensions that constitute the argumentation competence according to Grundler

Batch of visual resources

Image
It's summer and I though it would be nice to spend more time outside, so I'll change the format of the post today.      A Book: Universal Principles of Design This is a great read. There is a lot of good scientific supported advice on how to improve a presentation. From the visual to the organization and cognitive front. You don't have to be a psychologist or a industrial design to understand and enjoy it. I counted at least 20 principles that directly apply to presentations. For example the Picture Superiority Effect and Iconic Representation which leads me to... Links to get images and icons The Morgue Files offers stock-photography-quality images from free, even for commercial purposes. TinEyes Lab provides a Flickr search by color. The Noun Project "collects, organizes and adds to the highly recognizable symbols that form the world's visual language." Another item  in Universal Principles of Design is the Signal-to-Noise Rati

Turn rocket science into the Rocket Man: Scientific and presentation writing. Part 1.

Image
Finding the right words and connecting with the audience are two problems scientific communicators face.  One way the overcome this problem is to turn scientific writing into presentation writing.   One of the smartest things I have read in the last weeks about presentation was Great presentations rely on great writing.                         — John Rode, Slide Rocket Great writing implies clear thinking, thoughtful structure, and respect for the audience, among many other things. No wonder great writing is hard work, really hard work. Professors and young researchers know this. In fact they strive to achieve excellence in scientific writing. And here is where the problem starts: Scientific writing is not the same as presentation writing. Last week Gavin MacMahon offered a free webinar on the 6 different types of presenters there are The storyteller and the coach The counselor and the teacher The inventor and the coordinator, their strengths and weakness and h

How to make better LaTeX/Beamer slides. Part 2.

Image
In part 1 , I talked about how using no Beamer themes and creating atomic slides are  better ways to create better visuals. Now I would like to talk about a particular case of transition between slides that look the same but  make a comparison. Take a look at this three slides: I have also applied a certain continuity to show a comparison. The problem here is that the continuity weakens the comparison's contrast.  Up to a certain degree amplifying the contrast makes the comparison clearer, hyperbole is also unwanted and unprofessional. In this case clear signalization of  the different experiment and the change of parameters (plus getting rid of the noise) would be enough. It is also worth think about if all the same data has to be compared or if only a selected subset makes the point. Remember that too much information has a toll on the working memory. If too much information is presented your audience most likely be overwhelmed processing it. Leave the full comparison for

How to make better LaTeX/Beamer slides. Part 1.

Image
I still hate Beamer. But that won't stop people from using it to give the worse-than-powerpoint scientific talks. Instead, I give a concrete example on how to improve an existing stack. Two weeks ago a good friend gave a presentation on the status of this research in applied math, and obviously he used LaTeX's s Beamer package. His use of Beamer is rather decent but I think it can be pushed  a nudge further. Here is how. The fundamental problem of Beamer is that it forces the user to use templates. The problem with most Beamer templates is that their have so much noise, that the message is generally lost in the midst of that noise. Here is the list of irrelevant things  in this slide: A "progress bar" on the top right.  The affiliation's logo on the bottom left. A date, the name of of speaker, the name of the presentation and the slide name on the bottom. Neither does your audience need that nor does it care about it! So get rid of it. The mess

Quick tutorial: Getting more typograhical options in Keynote

Image
Before I wrote the last post about Keyboard shortcuts, I dig into the  ⌘+T that opens the font window: If you click on the tools (gear) drop-down on the bottom left, you will find the Typography dialog, which opens a whole new set of typographical options. The specific options depend on the typeface. Some like Roboto have just a few, and some like Adobe Hypatia have many. Here is a concrete use of this dialog. Last week I was doing some slides using Roboto and  noticed how ugly the fi ligature was. I was thinking about write the f and the i separately and join them by hand, which is a dangerous and time consuming job. But after I discovered the Typography dialog, it was just click-easy: Here is another possibility, this time using the Ubuntu font.  Using this font the spaces between numbers can either we set to constant or proportional. So, if you are constraint by horizontal space, this might be something you want to try: One last thing, the differences of options betwe

20+ useful Keynote keyboard shortcuts

Image
Finally, last night out of frustration I googled Keynote's keyboard shortcuts. Wow, why did I do this before?  Knowing these shortcuts will help me be more efficient, and it also might help you. Note that I skipped the obvious and not included paste, smaller and out. If copy is c , paste is v . If bigger is + , smaller is −. If in is >, out is <. This is a small subset of all the Keynote's shortcuts, and it is mainly for slide editing. One piece of advice, learn two or three shortcuts, practice them, and when you have automated them, then learn one or two more, practice them, and…

Visual examples: seeking for a concept

Image
You might remember professor's Jay Lehr 1985 article "Let there be stoning!" about the state of scientific talks. Inspired by it, I have been working on a slide stack about presentations . It is still work in-progress, but it has been a while since I posted some visuals, so here a sneak peek of it. Just a legal matter, all of the images under CC licenses and were taken either from Wikipedia or Flickr. The point of this example is to seek unity, a concept, among the slides. Keynote or PowerPoint templates provide a unity concept, at the expense of death by Powerpoint.  Getting to that unity has proved, at least for me, extremely difficult. Going through this stack makes me uncomfortable knowing that although there is similarity there is no unity.